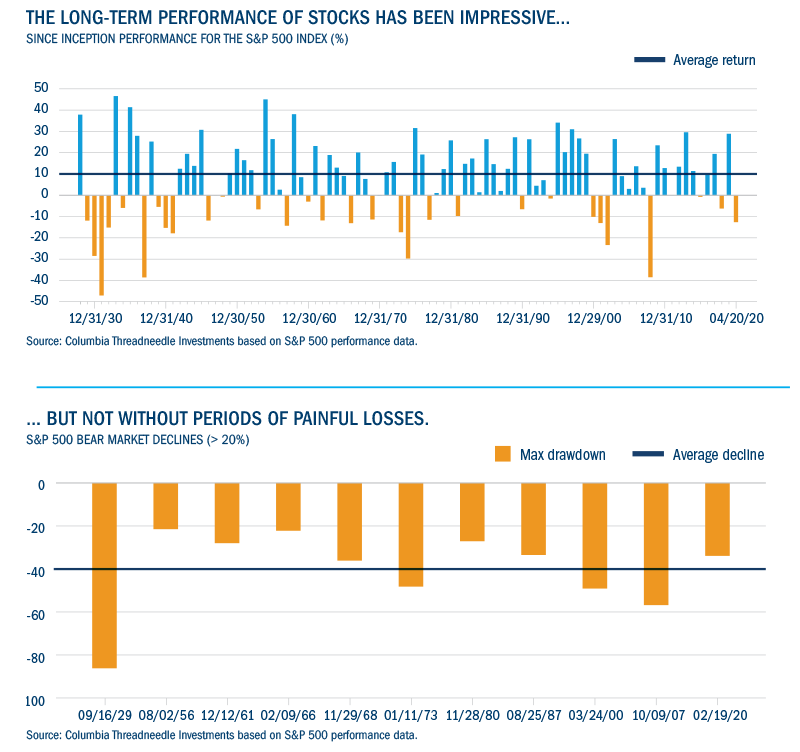
10% - As you read this article, remember this figure.
That’s the approximate average annual return of the S&P 500 Index, the standard measure of stock performance in the US, since its 1926 inception date.1 The key word here is average: there have been a lot of dramatic ups and downs over those 94 years. It is also testament to the power, consistency and resilience of the stock market — the rate is so robust that long-term returns for stocks have outpaced other major asset classes, such as bonds and commodities, by a wide margin.2 For investors who have committed to staying invested for the long term, the benefits have been generous.
What have we learned from investing through bear markets?
What recovery might look like
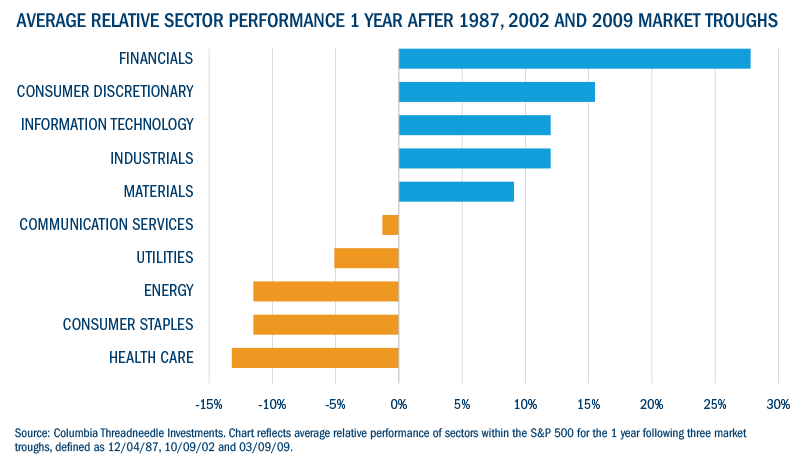
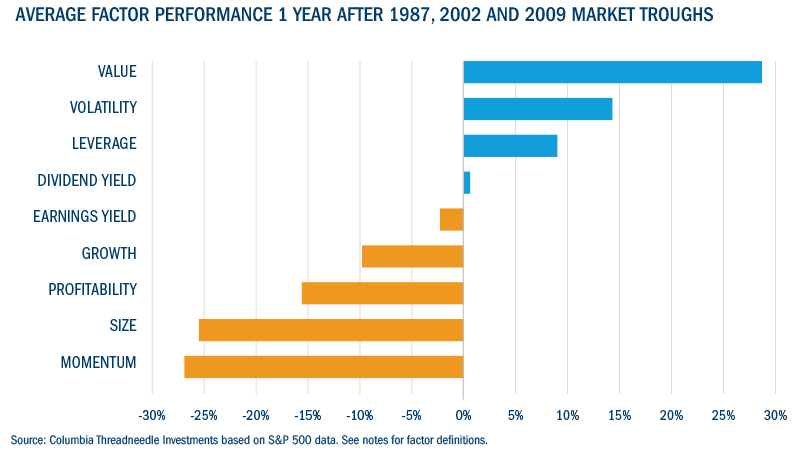
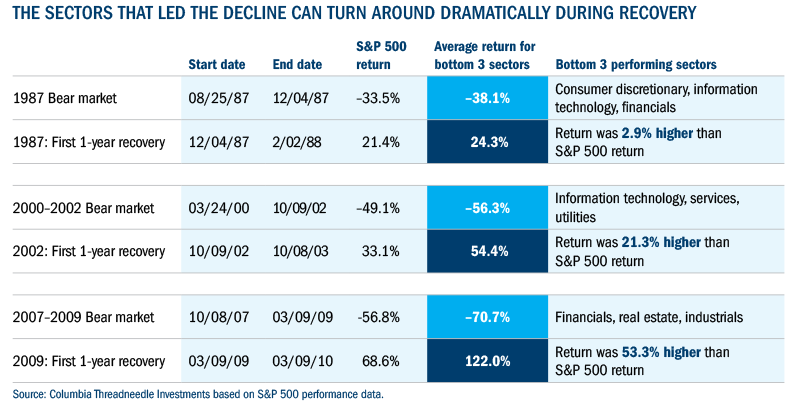
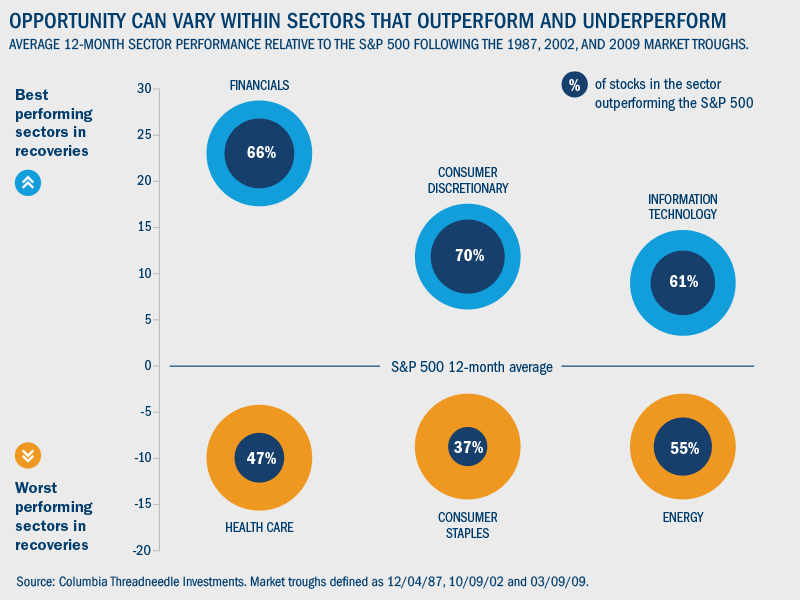
- Financials, consumer discretionary and information technology were winning sectors in aggregate. But hit rates — the percentage of stocks that outperformed — within those sectors were 66%, 70% and 61%, respectively, relative to the entire market over the 12-month post-trough period.
- Healthcare, consumer staples and energy sectors underperformed in aggregate, but hit rates within those sectors were still 47%, 37% and 55%, respectively, relative to the entire market over the 12-month post-trough period.
Conclusion
Important information: For use by Professional and/or Qualified Investors only (not to be used with or passed on to retail clients). Past performance is not a guide to future performance. Your capital is at risk. The value of investments and any income is not guaranteed and can go down as well as up and may be affected by exchange rate fluctuations. This means that an investor may not get back the amount invested. This document is not investment, legal, tax, or accounting advice. Investors should consult with their own professional advisors for advice on any investment, legal, tax, or accounting issues relating to an investment with Columbia Threadneedle Investments. The analysis included in this document has been produced by Columbia Threadneedle Investments for its own investment management activities, may have been acted upon prior to publication and is made available here incidentally. Any opinions expressed are made as at the date of publication but are subject to change without notice and should not be seen as investment advice. This document includes forward looking statements, including projections of future economic and financial conditions. None of Columbia Threadneedle Investments, its directors, officers or employees make any representation, warranty, guaranty, or other assurance that any of these forward-looking statements will prove to be accurate. Information obtained from external sources is believed to be reliable, but its accuracy or completeness cannot be guaranteed. Issued by Threadneedle Asset Management Limited. Registered in England and Wales, Registered No. 573204, Cannon Place, 78 Cannon Street, London EC4N 6AG, United Kingdom. Authorised and regulated in the UK by the Financial Conduct Authority. This document is distributed by Columbia Threadneedle Investments (ME) Limited, which is regulated by the Dubai Financial Services Authority (DFSA). For Distributors: This document is intended to provide distributors’ with information about Group products and services and is not for further distribution. For Institutional Clients: The information in this document is not intended as financial advice and is only intended for persons with appropriate investment knowledge and who meet the regulatory criteria to be classified as a Professional Client or Market Counterparties and no other Person should act upon it. Columbia Threadneedle Investments is the global brand name of the Columbia and Threadneedle group of companies.


