
Guide to investing
Before you invest with us, please ensure you have downloaded and read the relevant Key Investor Information Document (KIID). To request a printed copy please visit the contact us section of our website. The information is required by law to help you understand the nature and the risks of investing in a fund. View our KIIDs.
Please remember that past performance is not a guide to future results. The value of your investments and any income from them is not guaranteed and may go down as well as up. You may not get back the full amount invested.
How to invest
There are a few different ways in which investors can buy funds: direct from the fund manager, via a fund platform, or via a financial adviser.
A financial adviser will help you choose what to invest in. He/she will discuss your financial goals, your attitude to risk and advise you of the most appropriate investment for your circumstances.
If you know what you want to invest in and have decided that you do not need advice, you can invest using a broker (they do not give advice and are also known as an execution-only broker or a discount broker), a fund platform or you can invest directly via the fund management company.
There are different ways of investing into a fund. You can use a tax-efficient wrapper such as an Individual Savings Account (ISA) or Self Invested Personal Pension (SIPP), alternatively you can invest directly in the fund, and can choose whether to invest a lump sum or make regular investments.
There are many ways to invest and different types of investments. If you are unsure of what is right for you, or are interested in adding less mainstream assets to your portfolio, you should seek the advice of a qualified financial adviser before investing.
Useful links
Columbia Threadneedle Investments does not offer investment advice. Please speak to your financial adviser to find out whether Columbia Threadneedle Investments has investment solutions that are suitable for you. If you do not have a financial adviser please visit
for details of one in your area.
Application forms
Once you have read the information above, including the Key Investor Information Document relevant to the Fund in which you wish to invest in, please download an application form.
Transaction checklist
To avoid any unnecessary delay in processing your investment request, the Financial Conduct Authority (FCA) requires us to carry out client verification checks
The checklist below outlines the documentation we require before we can carry out your request. Please refer to this list before making a transaction with us.
What investing means
Investing is when you put your money to work to help you meet your long-term financial needs. When you invest, you take more risk with your money than you do with a high street savings account, but for that risk you hope to have a greater chance of a higher long-term return.
The value of £10,000 invested over the last 20 years.
There are many different types of investments and each has its pros and cons, but while investing can potentially help you grow your money, it can also result in you losing some or all of it. The chart shows the returns an investor could expect to receive having invested £10,000 over the last 20 years in various different investment types.
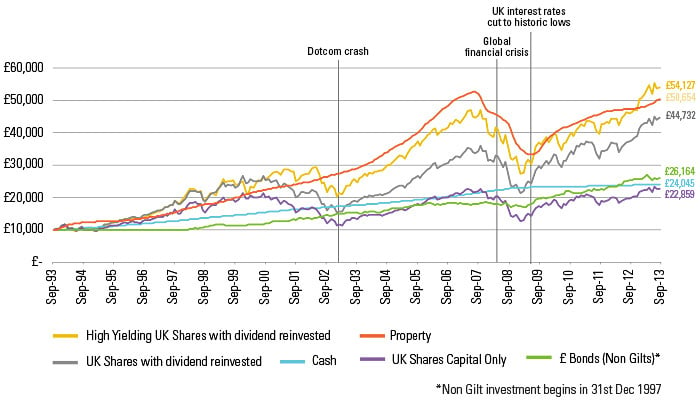
Source: Thomson Datastream and Threadneedle as at 30.09.2013. Cash represented by Three Month LIBOR rate. UK shares represented by FTSE All Share Index, capital return only. UK shares with dividend income reinvested represented by FTSE All Share Index, with dividends reinvested. High yielding UK shares with dividend income reinvested represented by FTSE 350 Higher Yield Index, with dividends reinvested. £ Bond (Non Gilts) represented by IBOXX £ Non Gilts All Maturities. Property is represented by Investment Property Databank (IPD). For illustration purposes only.
The returns from each type of investment go through peaks and troughs over the years. The chart illustrates that choosing the right asset class, depending on your investment goals and timeframes is critical. The chart uses market indices so does not necessarily reflect what an investor would have received by investing in a collective fund. The figures represent the actual returns from each index and do not include any charges, fees or taxation levies, that an investor would expect to incur. It is not possible to invest directly in these indices. There are different risk factors involved when investing in equities compared with cash deposits and investors are reminded that the value of investments and any income from them can go down as well as up. Past performance is not a guide to future returns.
Should you invest?
Before you invest you need to ask yourself whether it’s the right time. Generally, people are in a better position to invest if they have paid off debt, have adequate pension provisions, and have already accumulated enough cash in savings to cover any short-term expenses or financial goals, such as car repairs, holidays, home maintenance etc.
If you have all that covered, you are likely to be in a better position to invest for the longer term and assess your attitude to risk. In order to get a better return, an investor must take on more risk, which usually means investing in something riskier than a bank or building society savings account. Taking greater risk with your savings can potentially help you to grow your money faster over the long term, but there is a danger you could lose some or all of your cash.
To help reduce the risk, a sensible investor usually constructs a diversified portfolio that is spread among a number of different types of investment (also known as asset classes). Asset allocation – the practice of dividing your investment portfolio among different assets such as cash, equities, bonds, property and commodities – is the key to aiming to smooth your overall returns. The theory is that you reduce your overall risk of losing money because each asset class has a different correlation to the others; for example when shares rise, people may find bonds less attractive so the prices may often fall. At a time when the stock market begins to fall, investors may seek to invest their money in ‘real’ assets such as gold or property. By diversifying a portfolio investors will seek not to second guess these fast moving markets where one asset outperforms another and then falls back, but by smoothing overall returns with a portfolio containing a mixture of these assets.
To truly diversify investors should look to diversify within each asset class they own too. Looking at shares alone, for example, investors could spread their investments between large and small companies, between UK and overseas companies, and across sectors that are likely to perform differently at different times such as the retail sector versus pharmaceuticals.
Understanding your own attitude to risk will help you pick investments that deliver the return you expect. Think about your investment objectives and timeframe – the more time you have, the more risk you may be able to take. Consider your risk appetite: higher returns often mean higher volatility and higher risk, but if you can’t stomach losing money then you shouldn’t look to take on too much risk.
Types of investment
Investors can choose to invest in anything from savings accounts and property, to the stock market and fine wine. Only by learning about each can you make an informed decision as to which asset you feel most comfortable investing in.
Definition
Cash is the stuff that sits in your back pocket or your purse and can be deposited in current accounts and savings accounts. Sophisticated fund managers can also keep investors’ money in cash. They might hold a tiny part of an investment fund in cash to keep it safer than other assets, or they might run a fund that only invests in cash deposits.
Main characteristics
Cash is a safer asset than, say, shares or bonds, so the returns are typically smaller. In theory a bank could fail, but the Financial Services Compensation Scheme (FSCS) guarantees £85,000 per person on deposits, per authorised bank or building society.
Risks
The main risk with cash is that the returns are usually far lower than with other assets, making it more likely to be eroded by inflation. Think of a basket of goods worth £100 today. If inflation was 2% consistently, in 40 years time you would need approximately £220 to buy the same basket of goods. If you are investing for the long term and need to generate an inflation-busting return you need to find an account that beats inflation.
Definition
An equity, also known as a share, gives investors a stake in a company. If the company does well the value of the shares may rise and you may be able to sell them at a profit. However, they may also fall, making them a high-risk asset. Shareholders are also entitled to share in any profits made by a company, which are usually distributed in the form of a dividend payment.
Main characteristics
Equities can be bought and sold on stock exchanges around the world – in the UK alone there is a vast array of company shares to choose from. Investors can make a return when the price of a share goes up (though some sophisticated investors can actually bet on a share price falling) and also if the company distributes a share of its profits through income payments called ‘dividends’. Not all companies that make a profit pay dividends, however – they may choose, for example, to reinvest that profit in the business.
You can also buy equities listed on stock exchanges around the world, from the more developed markets of the US, Europe and Japan to high-risk developing markets such as Brazil, Russia, India and China.
Risks
A company’s share price can be affected by a huge number of factors, from the number of products a company sells to issues that affect whole national economies – making equities a risky investment. If the company doesn’t do well, you may not get any dividends and the value of the shares could fall or, in some cases, cease to have any value at all. If the company went bankrupt all shares are likely to be worthless. As there is a chance you might not get your money back, equities are considered higher-risk investments.
However, they also have the potential to make a generous return, making them a popular choice of asset for most investors looking to invest for the long term, whether directly or via a collective investment fund.
Definition
Bonds are loans to companies, local authorities or the government. So you lend your money to a company or government and you are paid interest in return. They usually pay a fixed rate of interest each year (known as the coupon) and aim to pay back the capital at the end of a stated period (known as the maturity date). This is why bonds are sometimes referred to as fixed interest.
Main characteristics
Corporate bonds are issued by companies such as Tesco and BT Group as a way of raising money to invest in their business. Government bonds are issued by a government – in the UK these are known as gilts. Once a bond has been issued, it can be traded on a stock exchange, where the price will rise or fall based on supply and demand; while it can also be influenced by the wider economy and investor predictions of how bank interest rates will change.
Risks
You will usually receive a smaller coupon from institutions that are more creditworthy and a larger coupon from those less creditworthy, reflecting the higher risk that they might not pay you back. The amount of interest a bond or gilt pays is fixed, which means that if interest rates fall they can become more attractive; though if interest rates rise they become less attractive, as investors may not be willing to accept the extra risk for less return compared to savings accounts if the coupon is not much higher.
Definition
Investors can invest in the buy-to-let market or commercial property – shops, offices and industrial warehouses, usually accessed via a collective fund of some type rather than directly. Investors benefit from rental income and the price of the property itself should it rise in value.
Main characteristics
Commercial property is very different from residential property (i.e., the house we buy, sell and live in) and does not always rise and fall in line with residential property market movements.
Risks
The value of the property itself could fall in value, while buildings might remain empty, meaning there will be no tenants to pay rent. Moreover, commercial property is not a ‘liquid’ investment, meaning it can be difficult to buy and sell property quickly and easily and valuations are based on opinions, not fact, as property is difficult to value accurately and costs a lot of money to buy and sell. But many investors like to include some property in their portfolio because it helps them to diversify: for example, investors might still receive rental income even if equity dividends fall and vice versa.
Definition
Commodities are raw materials for production: agricultural products such as wheat and cattle, energy products such as oil and gasoline, and metals such as gold, silver and aluminium. There are also “soft” commodities, or those that cannot be stored for long periods of time, which include sugar, cotton, cocoa and coffee.
Main characteristics
Whether it’s metals, energy or agricultural products, commodities are often traded on a ‘futures market’, where buyers purchase the obligation to receive a specific quantity of the commodity at a specific date and price. This helps protect commodity producers because it often takes a long time to produce, say, grain, and during that time prices could fluctuate dramatically.
Risks
Commodities are generally considered to be riskier than other assets and are highly volatile. They are very dependent on outside forces such as the wider economy, or political issues, such as oil in the Middle East. They are therefore only suitable for sophisticated investors.
Collective investments
Instead of buying assets – such as equities – directly, investors can pool their cash with others by investing in a collective investment, such as a fund. They invest across a wide range of companies, sectors, countries and, often, other funds.
Collective funds allow investors to diversify their assets at the same time as accessing the experience of a professional fund manager. Investors can invest lump sums of as little as £1,000 or set-up regular savings plans from as little as £50 a month. Please note that these sums vary between groups – always check before investing.
Collective funds are sometimes grouped into geographical areas such as the UK, Europe, the US or Far East, and are further categorised by their investment strategy such as Growth or Income . There are thousands of funds split into many different sectors. The most common type of collective investments are collective investment schemes such as unit trusts/open ended investment companies (OEICs) and investment companies.
A unit trust is an investment fund shared by lots of different investors. The fund is divided into segments called ‘units’, which investors buy to own a stake in the fund. The price of each unit is based on the value of the assets owned by the fund. Unit trusts are open-ended, meaning they get bigger as more people invest and smaller as investors withdraw their money. There are usually two different prices, making a unit trust a “dual priced fund”.
The two prices are:
- The ‘offer’ price – the price you pay to buy units, and;
- The ‘bid’ price – the price you get for selling units.
The difference between the buying and selling prices is the bid/offer spread, which broadly comprises the initial charge plus the difference between the buying and selling prices of the underlying investments plus any other costs involved in buying or selling the underlying investments.
This means that when investments are bought or sold as a result of other investors joining or leaving the fund your investment is sheltered from the costs of these transactions. The buying (offer) and selling (bid) prices of the fund are generally dependent on whether more people are buying units in the fund than selling, and vice versa.
Open-ended investment companies (OEICs) work in the same way as unit trusts but package their investments into shares – not units – and have a single price, so there is no bid/offer spread. Like a unit trust, an OEIC is open-ended so the size of the overall fund will get bigger or smaller as more or less people invest. Sometimes, a fund manager will charge investors in a single priced fund a “dilution levy” or “adjustment”. This is done to protect existing shareholders from the costs of buying or selling underlying investments, as a result of large investors joining or leaving the fund. A dilution adjustment affects everyone who deals on a particular day when there are large investors joining/leaving the fund, whereas a dilution levy only affects the individuals who trigger the price movement.
Offshore funds work in the same way as unit trusts or OEICs, but are domiciled in an offshore territory (such as the British Virgin Islands or the Cayman Islands) where the tax regime is often favourable to the investment manager or the investor. Income in the form of dividends, for example, can be subject to less tax than it would in a UK-domiciled fund. This tax-free income can be reinvested for even greater capital gains.
But while the tax advantages can lead to increased performance or a higher level of income, offshore funds are sometimes not subject to the same rigorous financial regulation as domestic funds, making them generally higher-risk – and not ideally-suited for beginner investors.
Investment trusts are similar to unit trusts and OEICs in that they invest in shares, bonds or property and provide the opportunity for investors to spread risk. However, when you invest in an investment trust you are buying shares in a company – not units in a fund. Investment trust shares are quoted on the stock market and are thus publicly traded in the same way as equities. You take a stake in an investment trust by buying its shares.
Investment trusts are ‘closed-ended’ funds because there are a set number of shares and this number does not change regardless of the number of investors.
Investment trusts are considered slightly higher risk than unit trusts and OEICs because they are allowed to borrow money to invest – this is called ‘gearing’. An investment trust that is geared is a higher-risk investment than one that is not geared because the manager has borrowed that extra cash with which to invest.
Investment trusts are considered slightly higher risk than unit trusts and OEICs because they are allowed to borrow money to invest – this is called ‘gearing’. An investment trust that is geared is a higher-risk investment than one that is not geared because the manager has borrowed that extra cash with which to invest.
But while gearing can make investment trusts higher-risk, a manager who is highly-geared is likely to have a strong conviction that what he is investing in is a good prospect – or he wouldn’t take on that additional risk.
The value of the assets held by an investment trust may be different from the actual share price, which means their shares can trade at a discount or a premium to the value of the underlying assets. This exaggerates the pattern of share price performance – both upwards and downwards when compared to returns from unit trusts and OEICs.
If you are unsure whether investing in an investment trust is right for you, speak to a financial adviser.
Asset allocation
You must make sure you review your portfolio regularly because the right asset allocation for your needs will change over the years as your investment goals change.
For example, when you are in your twenties and starting investing for retirement you might have a high proportion of your money in equities, as you have 30+ years to ride out the peaks and troughs of the stock market. When you are retired you will concentrate on generating income from your capital and trying not to let your capital deplete too fast, so you may move more of your portfolio into bonds.
It is up to you to make sure your investments are still meeting your objectives as you move through life. But just as your goals may change, so your investments will go through periods of under and over-performance. This means you should always keep on top of your investments to ensure they are performing adequately.
Multi-manager funds / multi-asset funds
As the name suggests, Multi-manager funds invest in a number of underlying funds, which in turn invest in a range of different companies across varying sectors, regions and asset types . A Multi-manager will research these funds and select a blend of what he believes are the best funds available into one single fund.
Multi-manager funds come in two types:
Funds of funds invest in existing unit trusts, OEICs or investment trusts run by other fund managers.
Manager of managers give a selection of external managers a chunk of money to manage.
There will be a pre-set framework for the fund, which dictates how much of the portfolio should be given over to equities, fixed interest and other asset classes. The fund manager then decides which firms and managers have the best skills to run each part of the portfolio and hands out mandates telling each manager how their particular part should be run.
There are also hybrid multi-manager funds that use a mixture of both strategies.
Multi-asset funds invest across the asset classes and are categorised according to the mix of assets the manager invests in (i .e . what percentage of equities, shares, bonds and property he holds).
Tax wrappers
While the only certain things in life are death and taxes, there are tax efficient wrappers that allow investors to shelter their investments from tax.
Individual Saving Accounts (ISAs)
ISAs are a tax-free or tax efficient account for your savings or investments. In July 2014 new rules were introduced to ISAs which means they offer more flexibility to both savers and investors and allow individuals to shelter more money than ever before in a tax-free environment.
Savers and investors can now invest in any combination of cash and stock and shares they like, and are allowed to move their cash freely between the two types at any time. They can hold their cash and stock market investments with the same provider or choose different ones. So whereas previously you could only transfer money from a Cash ISA to a Stocks and Shares ISA, you can now switch money either way (this applies to previous years’ ISA savings too).
Junior ISA (JISA)
On 3 January 2011 Child Trust Funds (CTF) were scrapped for new savers and were replaced with JISAs.
A JISA allows family and friends to invest into a tax-efficient account on behalf of a child and there’s no income tax or capital gains tax to pay on the interest. The 10% tax on dividends taken at source remains.
JISAs are only available to children born on or after 3 January 2011, or children aged under 18 but born before 1 September 2002 (when the CTF was introduced) and so never had a CTF. However from April 2015 you can transfer your child’s CTF into a Junior ISA.
Parents can choose from a cash or a stocks and shares version.
Junior ISAs are free from income and capital gains tax
Your child can’t touch the money until they are 18 – the account is held in the child’s name but is opened and managed by you. The child can take control at 16, but can’t touch the money until they turn 18. Once they are 18, the money belongs to them to do with as they like.
Self-invested personal pensions (Sipps)
Sipps allow you to place a variety of pension assets in a tax-free wrapper, with no income or capital gains tax to pay. However, while the likes of equities, derivatives, futures & options and gold are included, some assets are not allowed to be placed within the Sipp wrapper.
For full details of which assets are allowed, speak to a financial adviser or your pension provider.
Tax treatment depends on individual circumstances. Tax concessions are not guaranteed and tax legislation may change in the future.
Charges and costs
When you buy a collective investment, there is a range of fees applicable, depending on how you invest.
For beginner investors, the thought of investments falling in value can be far more worrying than it is for experienced investors – usually because beginners have not fully analysed their attitude to risk. Learning about financial products and understanding the risk and rewards on offer can help even the most inexperienced investor to make informed investment decisions.
Initial fees: A one-off fee charged at the time you buy the fund. These have in the past been as high as 5.5% of the sum invested. A portion of this fee was typically used to pay financial adviser commission. However, advisers can no longer accept commission in this way due to legislation called the Retail Distribution Review (RDR). For this reason and also increased competition from discount brokers and fund supermarkets/platforms, initial charges have largely disappeared.
Ongoing charges figure (OCF): The OCF is an industry wide standard calculation that illustrates most fees and charges borne by a fund. This figure is used by investors as it offers a single snapshot of how much you are paying for a fund and makes it easy to see the impact of charges on returns.
The OCF is based on the last year’s expenses and may vary from year to year. It includes charges such as the fund’s annual management charge, registration fee, custody fees and distribution cost but excludes the costs of buying or selling assets for the fund (unless these assets are shares of another fund).
Annual management charge (AMC): This annual fee covers the cost of fund management. The AMC tends to be around 1% – 1 .5%. Actively managed funds tend to have higher annual management fees, while tracker (passive) funds tend to have lower charges.
Investors should note that these charges can vary considerably.
Please visit our fund charges and costs explained section for more details.
Property Expense Ratio (PER) – There are a number of costs related to running and maintaining property funds that are not covered as part of the Ongoing Charges Figure (OCF). These additional costs are grouped together to form the Property Expense Ratio (PER), which includes:
- Non-recoverable property management fees
- Service charge shortfalls and holding costs such as empty rates and security
- Rent review and lease renewal costs
- Maintenance and repairs (not improvements)
- Property insurance costs / rebates
- Amortised debt financing fees / costs
- Debt valuation fees
- Marketing of vacant space
- Project management fees (where not capitalised)
Understanding KIIDS
Before you buy a fund, you’ll be supplied with a document that will help you understand the nature and risks of the fund in which you are about to invest.
Under regulatory rules, this Key Investor Information Document (KIID) must list the following details:
- Exactly what you are purchasing
- What its key investment objectives are, as well as its investment policy
- How risky it is likely to be
- How it has performed in the past
- How much you will pay for it.
Most of these categories are self-explanatory, but it’s worth expanding on a couple of them. The risk and reward section, for example, is crucial: it is where the investment provider tells the investor exactly how risky the investment is, on a scale of one to seven, where one is the least risky and seven the most risky. By reading this, the investor can be under no illusion as to the potential volatility and risk of the investment they are about to purchase.
When it comes to charges, investors should also pay attention. The KIID lists the maximum charges you will pay when you buy as well as when you sell units in a fund. It will also tell you what you will pay in the way of annual running costs. But, crucially, it will not detail the effect of these charges on your investment, nor will it include any performance fees or transaction costs.
A practical information section will also list where you can find further information on the fund you have bought, where to find the latest price of your investment and performance details. It should also tell you how to switch your investment.
A KIID is a useful way for investors to compare funds offered by various fund houses as they all contain the same information to aid comparison.
Read it carefully to ensure you do not get any surprises once you’ve started your investment journey.
Supplementary Information Document (SID)
This offers additional information that is not in the KIID. A SID should contain the likes of:
- What to do if you change your mind about the purchase
- How to complain
- How you can escalate your complaint if you are unhappy with the response you receive from the fund manager
- Where you can seek compensation – namely, via the Financial Ombudsman – and how much you might be entitled to in compensation if successful.
Active share explained
A relatively new metric in some markets, active share measures how much a fund’s investments differ from the benchmark against which it is assessed. Used in conjunction with other data, active share can help investors understand whether they are getting what they expect from a fund manager.
We believe that we have a duty to demonstrate the value we deliver by providing information that enables investors to evaluate, monitor and assess our performance. To assist investors and to enhance transparency we now publish the active share of our equity funds each month.
WHAT DOES ACTIVE SHARE MEAN AND HOW IS IT CALCULATED?
Active share provides a measure of the degree to which a fund manager selects stocks that differ from the fund’s underlying benchmark.
Active share is relevant to long-only, unleveraged equity portfolios and is expressed as a percentage ranging from 0 to 100%. A fund with no holdings in common with its benchmark would have an active share of 100%, while a fund that holds every stock in the same proportion as the benchmark would have an active share of 0%.
Columbia Threadneedle Investments calculates active share in agreement with the academic work of Cremers and Petajisto : we take the sum of the differences in weights of the fund’s stock holdings versus those of the benchmark, and divide it by two.
IMPORTANT: LIMITATIONS OF ACTIVE SHARE
We publish active share in order to provide enhanced transparency and disclosure for investors. You should be aware however, that active share has limitations. It is not a stand-alone measure of good active management and it doesn’t always apply to all funds or investment markets in the same way.
A low active share figure does not necessarily mean a fund manager does not take active decisions, nor does a high active share figure in our view indicate that a manager is more likely to outperform. The following examples demonstrate this:
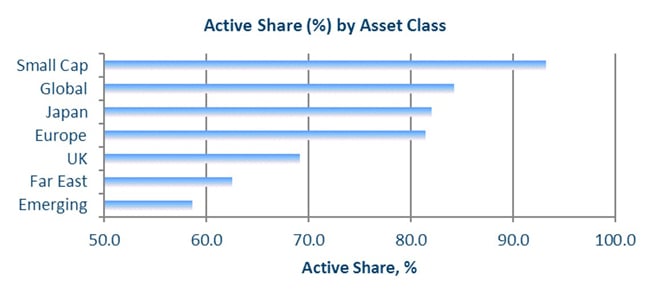
- The fewer stocks that make up a benchmark, the less a fund manager can deviate from it and the lower the active share will be. Consequently, a single country equity fund would be expected to have a lower active share than a global equity fund.
- At times when the largest stocks within a benchmark are relatively cheap, fund managers are likely to take advantage by buying more stocks in common with the benchmark. While this might benefit underlying investors, it would also reduce the fund’s active share.
- Due to prudent risk management processes, funds also have limitations on the extent to which a manager can deviate from a given benchmark.
The active share metric should therefore not be used in isolation. Active share is a helpful tool but should only be considered in conjunction with other data such as (but not limited to) the fund’s investment objective and history of risk-adjusted returns.*
It is important not to make a correlation between active share and expected future returns. Fund performance is largely dependent on the quality of investment decisions a fund manager makes, rather than how far they deviate from a benchmark.
If you are in doubt about the suitability of any investment, you should speak to your financial adviser.
COLUMBIA THREADNEEDLE INVESTMENTS’ ACTIVE SHARE
Source: Columbia Threadneedle Investments as at 31 July 2018.
*Past performance is not a guide to future returns
You may also like
Types of investment
We offer a broad range of actively managed investment strategies and solutions covering global, regional and domestic markets and asset classes.
Find your Fund
Columbia Threadneedle Investments has a comprehensive range of investment funds catering for a broad range of objectives.