An allocation to government bonds within a multi-asset
portfolio has traditionally played a vital role in terms of risk
management and diversification. However, the decadelong
bull era in both government bonds and equities has
led investors to ask whether this assumption is still valid.
Additionally, near-zero yields across the globe bring into
question the cost associated with this diversification benefit.
Bonds1 are usually included within a strategic asset allocation (SAA) of a multi-asset
portfolio for two main reasons:
- Income: They provide a stable source of income in terms of coupon payments, along with a capital cushion in a rising yield environment. For investors with explicit liabilities, this income stream gives bonds an important risk management role. In this paper our focus is on the role of bonds in the return portfolio rather than the liability-hedging portfolio.
- Diversification: In times of crisis, government bonds benefit from the flight-to-quality trade, partly driven by an expectation that central banks will stimulate growth by cutting rates.
The diversification benefit has been brought into question recently and we will analyse
the validity of this hypothesis. Also in this paper, we analyse how government bonds
interact with other asset classes in a multi-asset portfolio and discuss the investor
characteristics which allow us to perform a cost-benefit analysis for including fixed
income allocations within our strategic asset allocation.
Do bonds still diversify?
Over the past decade we have seen both bond prices and risk asset prices rise in
tandem. This behaviour has brought into question the traditional view of government
bonds acting as a diversifier to risk assets and diluted the traditionally negative
correlation between these assets. However, the main question here is what we mean by diversification. When building portfolios for our clients we are conscious
of two types of diversification:
- Average relationship: The extent to which assets have distinct
drivers in scenarios close to the base case. - Tail relationship: The behaviour of assets in downside scenarios,
i.e. crisis periods for the dominant portfolio drivers.
For example, the portfolios we construct for clients have exposure to an
array of different asset classes which have long-term positive expected
returns, and which are not perfectly correlated. As such the long-term
portfolio performance will benefit from different sources of return over time
and will deliver an average return which is diverse, or from a broad set of
asset classes – hence the term “average relationship”.
These portfolios are also designed including asset classes whose role is
to minimise drawdowns when markets enter risk-off periods, behaving as
diversified portfolios in downside periods – hence the term “tail relationship”.
Most joint asset class analyses focus on rolling correlations between
equities and bonds, but this is not an appropriate measure to understand
the tail relationships.
There is little benefit of achieving diversification only during “normal” market
conditions if safe asset classes such as bonds don’t protect the portfolio
when it matters. Measures such as rolling correlations amalgamate all
market conditions and so are not representative of investor preferences.
The best way to challenge this hypothesis is to analyse the behaviour of
equities and bonds in the tail.
For example, we have used US equity and government bond returns from
1871 onwards to analyse the behaviour of these assets during market
crashes and recessions, identifying 17 periods of crisis which range from
a one-month crash in equities to a four-year recession. Clearly, there is an
element of subjectivity with respect to choosing these periods, but they give
us a decent idea of the interaction between equities and bonds during tail
events. We have only used US data here for two main reasons: the length
and validity of the data is significantly better in the US compared to any
other economies; and global data would implicitly include multiple currency
returns, making it difficult to isolate asset class behaviour.
Figure 1. Relationship in the tail: equity and bond total returns
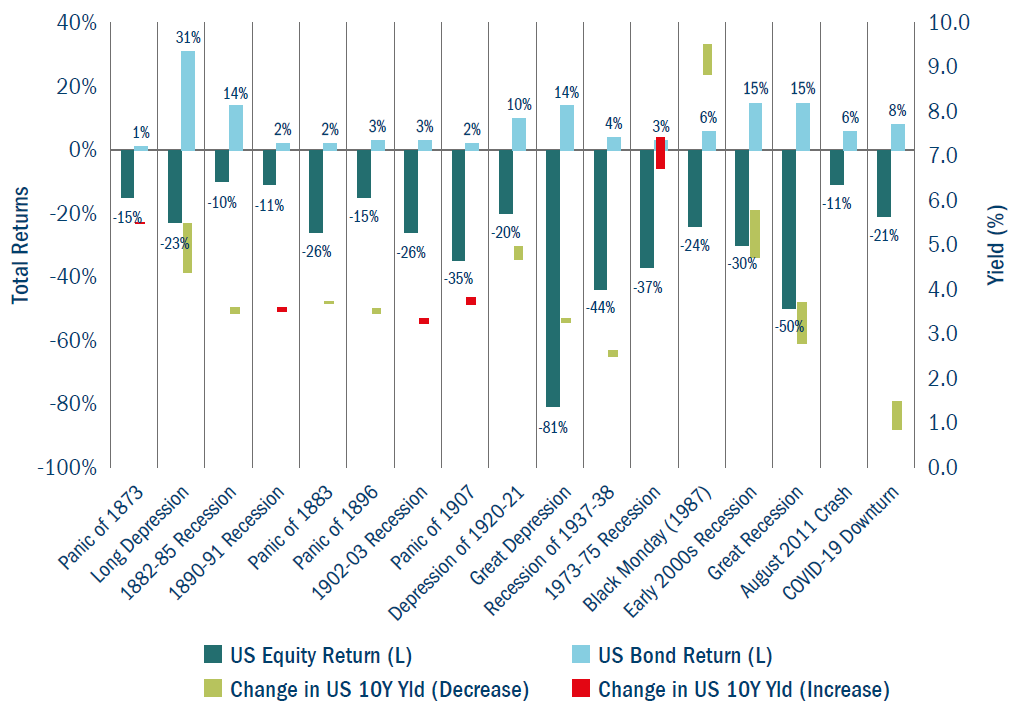
Source: Stock market data used in “Irrational Exuberance” by Robert J. Shiller and Columbia Threadneedle
Investments. Note: US equity returns are calculated by combining the S&P price and dividend data.
US bond returns are estimated by using the US 10-year yields and assuming a duration of eight years.
Past performance is not a guide to future returns.
As we can see in Figure 1, in every period of an equity market crash
bonds provided a positive return, and this effect does not appear to have
diminished over time. So, an allocation to government bonds does indeed
diversify away some of the risk within equities during tail events – and
even though it might seem that the negative correlation between equities
and bonds has been diluted when observing their average relationship,
the diversification benefit is still present in the tail. Additionally, this tail
relationship has stayed consistent across different regimes as demonstrated
by the 10-year yield at the beginning of each crisis period in Figure 1.
Is the cost of downside diversification justified?
As demonstrated in the previous example, although government bonds
do provide downside diversification in a multi-asset portfolio, we must ask
ourselves if the cost associated with this is worth the benefit. This question
is even more appropriate given the low yields across the globe, leading to
bonds being priced way above their historical average and therefore having
long-term expected returns which are close to the lowest in decades.
Unfortunately, there is not a simple answer to this question, and as with
most questions the true answer is “it depends”.
To illustrate this, let us think about the case of an umbrella on a typical
English day. Assuming there is a certain probability of rain on a given day,
different people will have a different outlook as to whether they need an
umbrella. An individual who is very averse to getting wet (for example, if they
are on their way to a date) is more likely to buy an umbrella, regardless of the
price. In contrast, someone who is not too bothered about getting wet will
perform some sort of cost-benefit analysis on the purchase of the umbrella.
This is not to cast any doubt on the ability or effectiveness of the umbrella
to protect them from getting wet, but more related to the risk aversion of
the individual.
For an investor to determine their allocation to bonds, they need to think
about their preferences and objectives. These can be distilled down to
three main characteristics:
- Time horizon: how long is the investment horizon
- Liquidity/cashflow requirements: is the investor looking to draw a regular income
- Dependency/reliance: is the investor reliant on this pot (e.g. for medical needs or education, etc)?
A combination of these three characteristics helps to situate an investor
on a spectrum from “outcome-driven” to “journey-driven”, which gives
an indication of the appropriate bond allocation within their SAA. For an
investor who requires a smooth performance journey over time, the portfolio
construction process should pay due attention to asset classes that can
provide downside protection via tail relationships. In contrast, for an investor
who is more relaxed about the path and is instead more focused on the
long-term outcome, we should aim to provide a well-diversified positive return
over time and attention should be given to the average relationship.
To bring this idea to life, let us imagine two hypothetical investors who
have different characteristics, and discuss how these characteristics have
an impact on their SAA (Figure 2).
Figure 2: Hypothetical investors and their characteristics
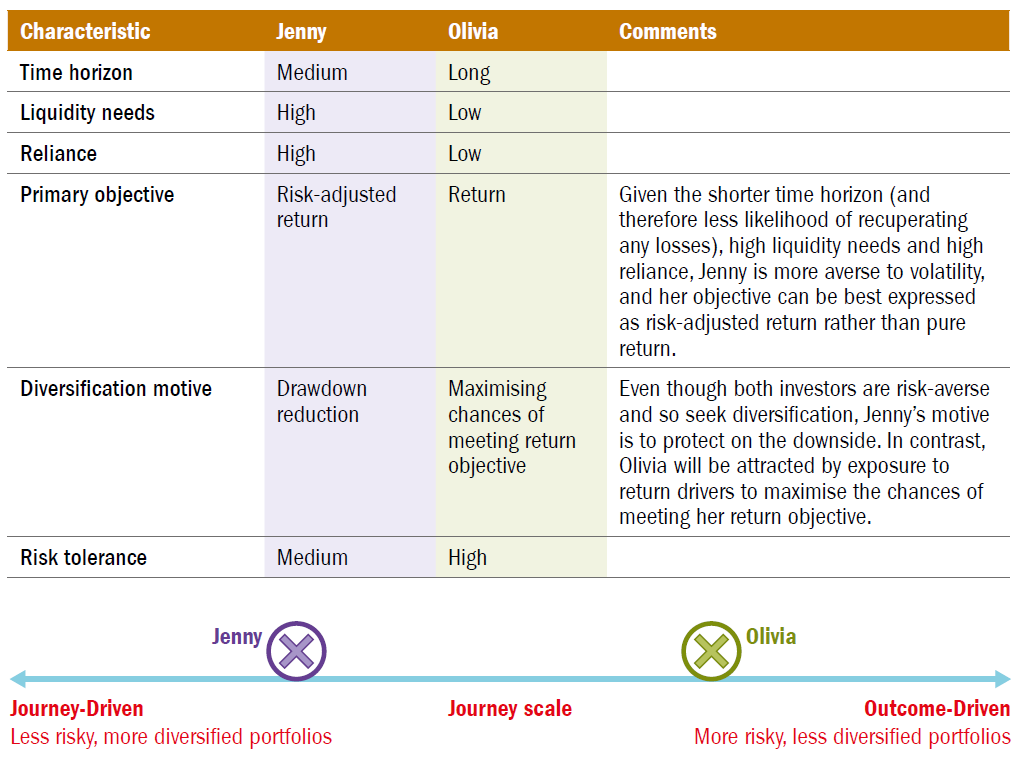
Source: Columbia Threadneedle Investments, for illustrative purposes only.
We can see from Figure 2 how the two investors differ in terms of the
three main characteristics of time horizon, liquidity needs and reliance.
These characteristics can then be used to infer some additional features
about these investors, as highlighted in the same figure.
Based on these, we can make some educated judgements about their
investment strategy:
(1) Jenny will likely have a higher allocation to fixed income than
Olivia given the tail relationship.
(2) Jenny will likely have a much lower allocation to real assets than
Olivia due to higher liquidity needs.
(3) Within equities, Jenny will likely be more exposed than Olivia to
developed equities rather than emerging market equities as the
average relationship becomes more important for Olivia.
We can then make an informed decision about the broad asset allocation
for the two investors. For example, Jenny is likely to have an SAA which is in
the region of 60% in equities and a modest allocation in government bonds
to make the portfolio more resilient. In contrast, Olivia will be happy to have
an 80% allocation in equities but a lower exposure to government bonds to
maximise the chances of achieving the return target. These allocations can
be thought of as the long-run asset allocation for each investor (Figure 3).
Figure 3: Long-run asset allocation for the two hypothetical investors
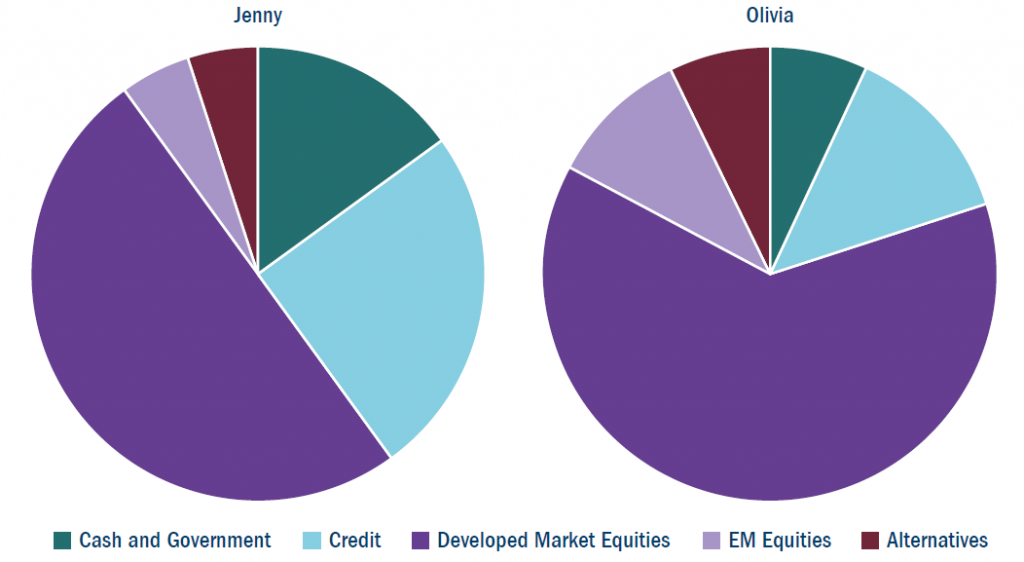
Source: Columbia Threadneedle Investments, for illustrative purposes only.
As mentioned, these asset allocations are derived from our long-run capital
market assumptions, which we forecast using long-term risk factors driving
income and growth across asset classes. However, we also need to be
aware of current asset valuations (eg, low yields) and how we expect them
to evolve over the business cycle, which we then translate into asset class
tilts around our long-run SAA.
At Columbia Threadneedle, along with the long-run capital market
assumptions, we also forecast asset class returns which are more informed
by asset valuations and where we are within a business cycle. Both sets
of capital market assumptions are constructed in a way that ensures
consistency across different time horizons.
We can then use these “valuation-aware” capital market assumptions to
tilt our long-run SAA to ensure we are aware of current valuations. This is
particularly important with respect to bonds given current yields across the
globe. For instance, while our long-run capital market assumptions assume
bonds are fairly valued, our valuation-aware view expects a degree of mean
reversion – which here means a rise – in yields and are therefore not as bullish. Similarly, our valuation-aware capital market assumptions are more
bullish on equities. All this will lead to the following tilts to the portfolios of
the two investors:
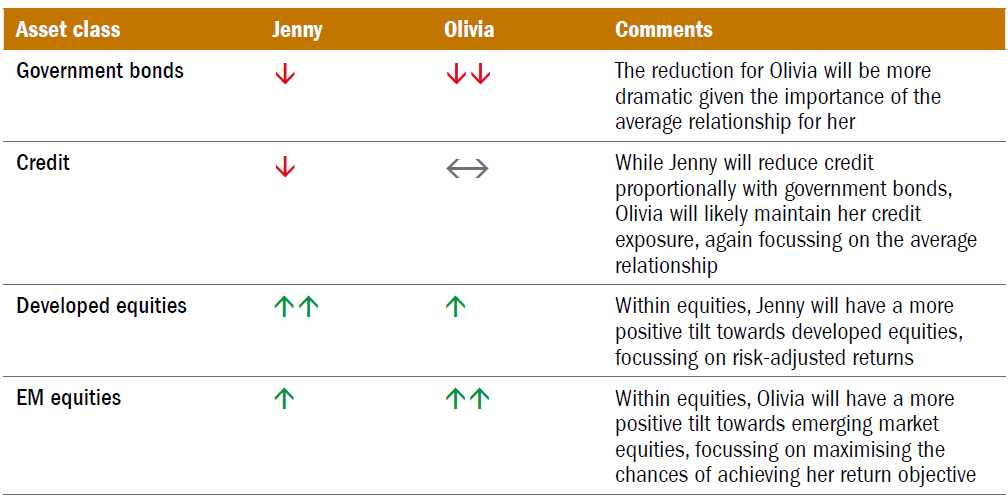
Source: Columbia Threadneedle Investments, for illustrative purposes only.
Summary
There has been much discussion in recent years about the diversification
benefits of bonds and if the cost of this diversification is worth it for
multi-asset investors.
Having analysed two sides of this diversification – the tail relationship and
average relationship – we can see that the tail relationship between equities
and bonds over the past 150 years shows that, even at historically low
yields, bonds have been an excellent tail diversifier in a multi-asset portfolio
during times of crisis. This confirms that government bonds still play a very
important role within multi-asset portfolios across many different regimes.
However, this does not take away from the fact that we need to perform
some level of cost benefit analysis when designing our investment strategy.
Any investment strategy needs to be informed by the investor’s
characteristics, which we have distilled into three main features: time
horizon, liquidity requirements and reliance. These can then be used
to infer the long-run asset allocation for the investor, ensuring the most
optimal portfolio given their preferences on average relationship versus
tail relationship. Additionally, this long-run asset allocation can be tilted to
ensure we are aware of current asset valuations, such as current record low
yields, while remaining consistent with the broad risk stance of the long-run
asset allocation. This process of designing a valuation-aware SAA ensures
that at Columbia Threadneedle we aim to deliver the most optimal journey
for the end-investor without any dramatic asset allocation changes through
the investment horizon.