In 2017 Britain invoked Article 50 of the Lisbon Treaty, triggering the initiation of proceedings to break away from the European Union. The Brexit vote, of the previous year, had been merely advisory, activating Article 50 meant there would be no turning back.
It was against this background and a favourably heady time in financial markets, in November of that year we launched a low-cost, actively managed multi-asset range; a risk controlled portfolio option designed to cover a host of growth and income needs – the CT Universal MAP range.
The differentiated offer for investors was access to a truly active strategy, delivered at a competitive fee on par with peers’ passive multi-asset strategies.
In the five years since the funds’ launch, the world has been all over the place. One view might be that this was a terrible time to start a multi-asset, risk-targeted, investment range. However, a more positive take, ours, is that it has also been a brilliant time because the volatility has given us the opportunity to showcase the benefits of active investing – differentiating our offer from more static, benchmark-aware products.
We wanted to avoid concentration risks, building a diversified portfolio across styles, factors and timeframes. While this would likely miss out on the highest highs it would also avoid the lowest lows, delivering clients a smoother return profile.
The heady days of launch
In 2017, global economic growth was accelerating and stock markets around the world were hitting record highs. The International Monetary Fund (IMF) stated, in October of that year, that “the outlook is strengthening, with a notable pickup in investment, trade, and industrial production, together with rising confidence.” After a decade when optimism had been in short supply, the IMF prediction that global economic growth would average 3.6% in 2017 was welcome news.
The Eurozone was a particular bright spot at the time. Growth was at a ten-year high and unemployment at a nine-year low. The US economy grew 3.3% in the third quarter of 2017, a three-year high, and unemployment was the lowest it had been since 2000. China was on course to beat its target of 6.5% growth in 2017 and even Russia, which had struggled for several years because of low oil prices, was seeing modest growth.
In the five years since that synchronised upswing the world has become quite a different place. The ‘sweet spot’ of inflation – low but no deflation – has evaporated and the extended era of low interest rates is behind us, at least for a few years.
A history potted in asset allocation
As 2018 approached, growth slowed and the markets ended the year on a sour note amid fears of recession. Using our balanced portfolio as the example, we reduced our allocation to US equities and topped up our holding in UK stocks. The US had enjoyed a period of good outperformance versus the rest of the world and it was time to lock in those gains. In fixed income, we swapped some nominal government bond exposure for inflation-linked and some high yield for investment grade bonds.
As the global growth outlook remained murky, we reduced our overall equity allocation. Within fixed income, we increased our UK government bond allocation at the expense of all other sectors. Mid-way through 2019 we had increased our equity exposure and especially towards the US as growth in the region accelerated. By the end of 2019, we were also adding to our UK equity exposure with a view that it appeared there might be an early resolution to the Brexit tangles on the back of a probable win for Boris Johnson at the December general election.

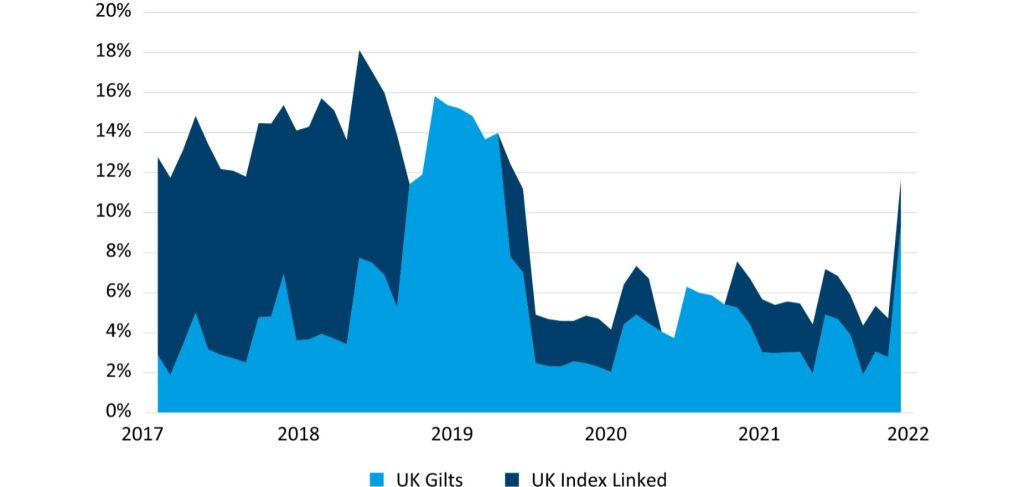
Source: Bloomberg and Columbia Threadneedle Investments as at 31 October 2022
X axis label: Percentage of portfolio allocation
Five years ago, the yield on the UK 10-year government bond was 1.38% so not hugely compelling. However, interest rates were only 0.5% at the time and it was clear that they would remain low for a while. Within the balanced portfolio we held around 13% in gilts, biased towards those inflation linked.
Inflation-linked bonds performed well over the following years. Then, when a negative return became expected, we sold our inflation-linked bonds in favour of investment in nominal government bonds.
In the early phase of the pandemic nominal bonds rallied very hard and 10-year yields collapsed to 0.07%. As well as re-introducing a position in inflation-linked bonds we cut nominal government bond exposure aggressively, as there was little portfolio benefit to holding such bonds anymore.
In late 2021, we were convinced that central banks had to start hiking rates to control inflation and although we had little exposure to government bonds we took out additional options protection in case of a jump in yields.
In 2022, we took the opportunity to buy in and sell out of gilts as the price fluctuated through the year but we maintained a very low exposure until late September. From this point we believed that there was now good value to be had by holding government bonds again. When yields went above 4% we added exposure via our strategic asset allocation process and then topped up through our tactical asset allocation mid-month.
As the world starts to worry less about inflation and more about growth, we think a larger government bond exposure is merited.
2020 was the year of the pandemic and this kept us more active than normal, reducing risk in February as the true nature of the pandemic was becoming increasingly apparent, before reintroducing risk when price levels became very attractive. As economies locked down and uncertainty spiked, the decision in the third quarter to have increased our exposure to UK markets proved correct as it outperformed most other areas on good news regarding vaccines and a successful furlough programme.
Through the stop/start reopening of global economies in 2021, we generally favoured equities over fixed income due to the prevailing low yields and expectations of further central bank stimulus. Our government bond exposure hit their lowest levels to date on the expectation of a change in central bank policy to start combatting the effect of inflation that was becoming clearly less transitory than anticipated. It took until the fourth quarter before this position started to pay dividends. Within equities, we had a bias to Europe and the US versus other regions and within fixed income, in line with our cautious approach, we preferred investment grade credit to government debt.

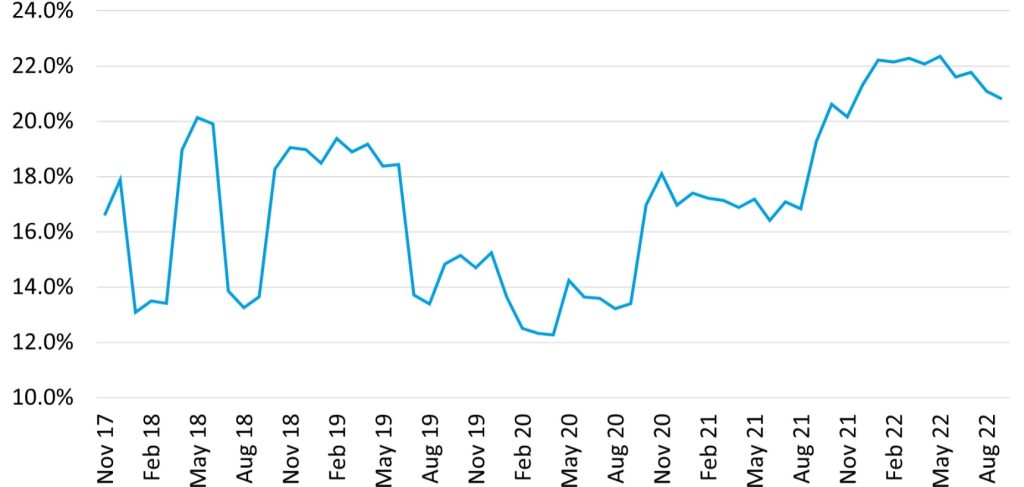
Source: Bloomberg and Columbia Threadneedle Investments as at 31 October 2022
X axis label: Percentage of portfolio allocation
Right from the start, our exposure to UK equities has been fluid. In 2018 we moved between global and UK equities as economies and valuations fluctuated. However, the effects of Brexit uncertainty coupled with the strength of the US economy, meant UK equities fell out of favour within the portfolio.
UK equities were, on many levels, cheap for a while. However, we waited until the third quarter in 2020 before buying back into the asset class. The stimulus for this was the development of vaccines which we expected would have a disproportionately positive effect on the UK economy, relative to peers, given the comparable importance of the service sector.
We further increased our allocation to UK stocks in late 2021 as the economy was opening up and growing at a healthy rate relative to the rest of the world. At the same time valuations were starting to look a little stretched in the US.
In 2022 the expected rotation from growth to value, which would be beneficial for the UK market, allowed us to reach our highest exposure ever to the UK market. The invasion of Ukraine by Russia, meant that the UK equity market would continue to flourish on a relative basis.
Cash ready for the about turn in growth
This year, with good news in short supply, inflation rising and interest rates climbing, all asset classes have had a difficult time. In the portfolios we have been cutting our equity exposure and have moved tactically underweight, although we retain an overweight to the FTSE100 on the view that multinational companies, in the index, should benefit from weaker sterling and the continued higher energy prices.
While the growth outlook is now fairly gloomy, the case for holding high-quality fixed income has become more attractive and having been underweight fixed income almost all of this year we have moved overweight government bonds. At the same time, we have reduced our exposure to both investment grade and high yield bonds, ready to deploy cash for when new opportunities arise.
Challenges and triumphs
The CT Universal MAP range has faced challenges from bull markets to bear markets, deflation to inflation and a global pandemic, accompanied by an artificially induced recession chucked in for good measure.
Our asset allocation calls have added value at all three levels, strategic asset allocation, tactical asset allocation and stock selection.
The diversification of timeframes and investment styles has given us the tools to navigate most market environments and enabled us to deliver top quartile returns to investors. What’s more, that top quartile performance has been achieved within risk parameters and at a cost that remains very attractive relative even to passive strategies.
So, as another trip around the sun beckons, we look forward to the challenges and triumphs that 2023 will bring. For more visit our CT Universal MAP range fund pages here.


