Asset allocation update: standing pat
Insights

Asset allocation update: standing pat

In a game of cards “standing pat” is to retain one’s hand as dealt, without drawing other cards. Standing pat also captures how we have managed our asset allocation in recent months, making few changes to our overall preferences. We continue to believe the best risk-adjusted returns will come from equities and corporate credit over the next 12-18 months, with persistent caution on core duration, and we are neutral towards cash, commodities and UK commercial property.

Figure 1: volatility-adjusted returns, January 1998 – May 2021

Annualised ytd may 21 graph

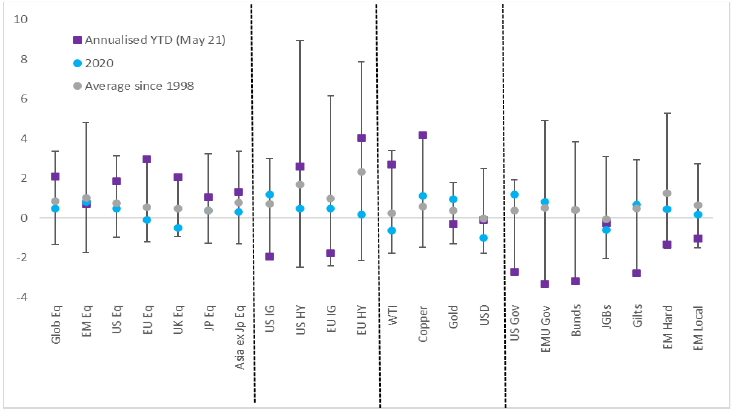
Source: Bloomberg, May 2021

More itinerant returns from financial markets in the first five months of the year have largely supported this positioning. Volatility-adjusted returns, or “Sharpe ratios”, have been punchy and well above respective medians and means in equities (and commodities), but exceedingly poor for long-duration fixed income assets, particularly government bonds (Figure 1)1. We have discussed ad nauseum why we judge developed market government bonds to be a remarkably poor source of return diversification – and with yields still historically low, locking in similarly low prospective returns, and growing fiscal profligacy, we take duration exposure sparingly across asset allocation funds.

Our allocations “under the bonnet” of broad asset class categories have been less fruitful, in two chief areas. First, in pointing our cyclical equity exposure towards Asian EM and Japan, which have lagged notably behind the UK and Europe; and second, in continuing to favour equally high-yield and high-grade corporate bonds, where returns have differed wildly. Let’s take a look at each in turn.

Kicking the tyres on equity regions

Underwhelming performance from Japan and emerging Asia has been surprising given the heightened sensitivity of earnings to global industrial production and exposure to cyclicals. For instance, “betas” of earnings to global industrial production in both regions are twice what they are in Europe and the UK2, helped by the more cyclical composition of Asian markets compared with the rest of the world. In each case, however, softer participation in cyclical rallies is explained by idiosyncratic factors – a combination of fresh waves of Covid-19, unhelpful domestic flows (underpinned by typical seasonal caution from Japanese equity analysts), and concerns of sharp policy tightening from Chinese policymakers in the second half of 2020.

While the latter would almost certainly be widely disruptive for risk assets, our expectations are for only a metered tightening: the authorities learned their lesson from previous over-tightening in 2017 and 2018, and our Asian equity colleagues welcome the improved quality of Chinese growth and earnings as a result of recent measures. With strong, above-consensus earnings expected both this year and next – Asia and Japan are expected to comfortably deliver double-digit compounded earnings growth between 2020 and 2022 that is several turns greater than Europe or the UK – and at a globally competitive price, we have maintained exposures in weaker markets (Figure 2).

We also stay constructive on US equities, where strength in the first quarter earnings season has been fairly astonishing. Earnings for S&P 500 companies have grown by 50% year-on-year, more than twice the (elevated) expected 24%; unusually, analysts have been marking up forecasts as the quarter progressed. As in the last quarter, the market has used this reporting season as an opportunity to post modest total return gains and to also derate. S&P 500 revenues are 10% higher compared with a year ago, against expectations of 6%, and our US equity colleagues point to upside risks to both revenues and earnings growth for the year as a whole.

Figure 2: What do you pay for earnings growth?

What does profit growth cost

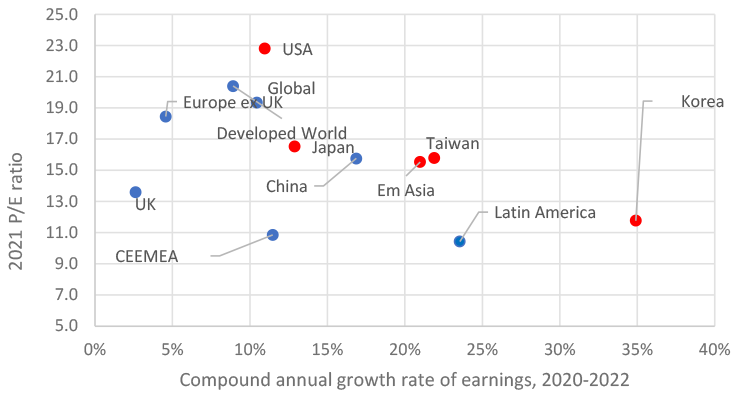
Source: Citi research, Worldscope, MSCI, Factset, 24 May 2021. Red marks our favoured regions. Note: the above data are compiled based on companies in the MSCI AC World Index. The market capitalisation for regions, markets and sectors are free-float adjusted. P/E, EPS Growth, P/B, Dividend Yield and ROE are aggregated from Factset consensus.

Drilling deeper into grades of credit

Total returns from high yield and high grade corporate bonds have also diverged meaningfully this year. To a degree this is driven by duration, which has fared poorly and impacts longer-maturity high grade much more than shorter-duration high yield. But it is also explained by differing underlying trends in risk. If one scales exposures across markets for the same level 12-month volatility (of, for example, the S&P 500), then high grade bonds have generated the best risk-adjusted returns by some distance – above both equities and high yield bonds (Figure 3).

Figure 3: Total returns, scaled by trailing 12-month volatility, 2002-2021

Vol levered graph

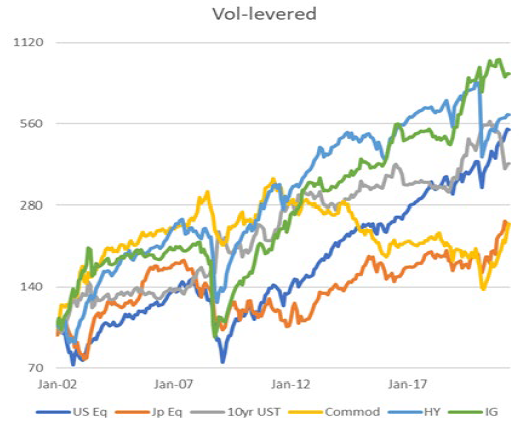
Source: Bloomberg, 24 May 2021. To create ‘same risk’ time series, scale exposures across markets so that each asset class volatility = 12-month SPX vol. Repeat next month, etc

After a weak first quarter, high grade bonds have treaded water, and given continued central bank support and significant improvements in underlying corporate fundamentals, we hold steady. We continue to direct our investments towards the excess spread offered by shorter-maturity European high yield bonds – which may be in a sweet spot from policy support, ongoing cyclical upswing and improving credit metrics, including dramatically lower default expectations for both this year and next, with higher expected recovery rates to boot.

Figure 4: Asset allocation snapshot

Asset allocation strongly dislike table

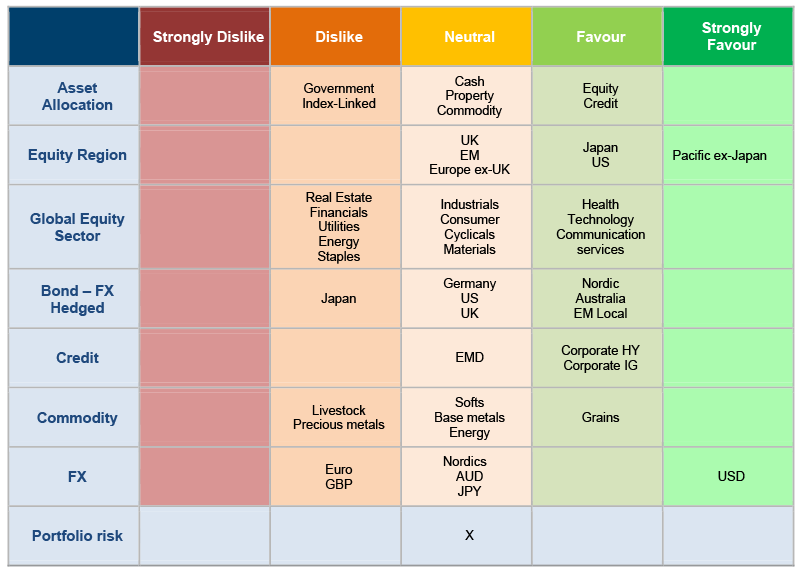
Source: Columbia Threadneedle Investment, 24 May 2021

28 May 2021
Toby Nangle
Toby Nangle
Global Head of Asset Allocation & Head of Multi-Asset, EMEA
Share article
Share on linkedin
Share on email
Key topics
Related topics
Listen on Stitcher badge
Share article
Share on linkedin
Share on email
Key topics
Related topics

PDF

Asset allocation update: standing pat

1 The best since the late nineties and early noughties for European and UK equities, and the worst over this period in European govvies, gilts and US treasuries.
2 7 to 8 times in Asian EM and Japan compares with 3 to 4 for Europe and the UK.

Important information

Important information: For use by Professional and/or Qualified Investors only (not to be used with or passed on to retail clients). Past performance is not a guide to future performance. Your capital is at risk. The value of investments and any income is not guaranteed and can go down as well as up and may be affected by exchange rate fluctuations. This means that an investor may not get back the amount invested. This document is not investment, legal, tax, or accounting advice. Investors should consult with their own professional advisors for advice on any investment, legal, tax, or accounting issues relating to an investment with Columbia Threadneedle Investments. The analysis included in this document has been produced by Columbia Threadneedle Investments for its own investment management activities, may have been acted upon prior to publication and is made available here incidentally. Any opinions expressed are made as at the date of publication but are subject to change without notice and should not be seen as investment advice. This document includes forward looking statements, including projections of future economic and financial conditions. None of Columbia Threadneedle Investments, its directors, officers or employees make any representation, warranty, guaranty, or other assurance that any of these forward-looking statements will prove to be accurate. Information obtained from external sources is believed to be reliable, but its accuracy or completeness cannot be guaranteed. Threadneedle Management Luxembourg S.A. Registered with the Registre de Commerce et des Societes (Luxembourg), Registered No. B 110242, 44, rue de la Vallée, L-2661 Luxembourg, Grand Duchy of Luxembourg. In the UK issued by Threadneedle Asset Management Limited. Registered in England and Wales, Registered No. 573204, Cannon Place, 78 Cannon Street, London EC4N 6AG, United Kingdom. Authorised and regulated in the UK by the Financial Conduct Authority. In the Middle East: This document is distributed by Columbia Threadneedle Investments (ME) Limited, which is regulated by the Dubai Financial Services Authority (DFSA). For Distributors: This document is intended to provide distributors with information about Group products and services and is not for further distribution. For Institutional Clients: The information in this document is not intended as financial advice and is only intended for persons with appropriate investment knowledge and who meet the regulatory criteria to be classified as a Professional Client or Market Counterparties and no other Person should act upon it. Columbia Threadneedle Investments is the global brand name of the Columbia and Threadneedle group of companies. Columbia Threadneedle Investments is the global brand name of the Columbia and Threadneedle group of companies.

Related Insights

14 March 2024

Andrew Carnwath

Director, Private Equity

LGPS Next Steps on Investments: a focus on private equity

We look at five questions LGPS funds may want to consider as they evaluate private equity and discuss how it might help them deliver both their return and impact ambitions
Read time - 5 min
15 February 2024

Hans Nordby

Head of Research & Analytics, Real Estate (US), Lionstone Investments

Joanna Tano

Head of Research, Europe, Real Estate (EMEA)

2024 Global Real Estate Outlook

What's in store for real estate in 2024? Global megatrends and financial conditions will impact returns and sector allocation.
Read time - 4 min
30 January 2024

Joseph Vullo

Head of European Real Estate

UK Real Estate: talking points January 2024

Buying opportunities are anticipated in H1 2024. Decisions should be guided by long-term trends, but the differences in opportunities between sectors will be crucial too.
Read time - 2 min
19 April 2024

Jim Griffin

Investment Content Manager

Market Monitor – 19 April 2024

A miserable month for global stock markets continued this week, with geopolitical concerns and further indications that central banks will be slow to cut interest rates adding to negative sentiment.
Read time - 3 min
17 April 2024

In search of sustainability – following Highway 101

Travelling down the US west coast we met 25 companies in five days. Learn more about the tech and healthcare businesses shaping our future.
Read time - 3 min
16 April 2024

Fixed Income Desk

In Credit - Weekly Snapshot

In Credit Weekly Snapshot – April 2024

Our fixed income team provide their weekly snapshot of market events.
Read time - 5 min
true
true

Important information

Important information: For use by Professional and/or Qualified Investors only (not to be used with or passed on to retail clients). Past performance is not a guide to future performance. Your capital is at risk. The value of investments and any income is not guaranteed and can go down as well as up and may be affected by exchange rate fluctuations. This means that an investor may not get back the amount invested. This document is not investment, legal, tax, or accounting advice. Investors should consult with their own professional advisors for advice on any investment, legal, tax, or accounting issues relating to an investment with Columbia Threadneedle Investments. The analysis included in this document has been produced by Columbia Threadneedle Investments for its own investment management activities, may have been acted upon prior to publication and is made available here incidentally. Any opinions expressed are made as at the date of publication but are subject to change without notice and should not be seen as investment advice. This document includes forward looking statements, including projections of future economic and financial conditions. None of Columbia Threadneedle Investments, its directors, officers or employees make any representation, warranty, guaranty, or other assurance that any of these forward-looking statements will prove to be accurate. Information obtained from external sources is believed to be reliable, but its accuracy or completeness cannot be guaranteed. Threadneedle Management Luxembourg S.A. Registered with the Registre de Commerce et des Societes (Luxembourg), Registered No. B 110242, 44, rue de la Vallée, L-2661 Luxembourg, Grand Duchy of Luxembourg. In the UK issued by Threadneedle Asset Management Limited. Registered in England and Wales, Registered No. 573204, Cannon Place, 78 Cannon Street, London EC4N 6AG, United Kingdom. Authorised and regulated in the UK by the Financial Conduct Authority. In the Middle East: This document is distributed by Columbia Threadneedle Investments (ME) Limited, which is regulated by the Dubai Financial Services Authority (DFSA). For Distributors: This document is intended to provide distributors with information about Group products and services and is not for further distribution. For Institutional Clients: The information in this document is not intended as financial advice and is only intended for persons with appropriate investment knowledge and who meet the regulatory criteria to be classified as a Professional Client or Market Counterparties and no other Person should act upon it. Columbia Threadneedle Investments is the global brand name of the Columbia and Threadneedle group of companies. Columbia Threadneedle Investments is the global brand name of the Columbia and Threadneedle group of companies.

You may also like

Investment approach

Teamwork defines us and is fundamental to our investment approach, which is structured to facilitate the generation, assessment and implementation of good, strong investment ideas for our portfolios.

Funds and Prices

Columbia Threadneedle Investments has a comprehensive range of investment funds catering for a broad range of objectives.

Investment Strategies

We offer a broad range of actively managed investment strategies and solutions covering global, regional and domestic markets and asset classes.

Thank you. You can now visit your preference centre to choose which insights you would like to receive by email.

To view and control which insights you receive from us by email, please visit your preference centre.

Woman listens to music through headphones
Play Video

CT Property Trust- Fund Manager Update

Sed ut perspiciatis unde omnis iste natus error sit voluptatem accusantium doloremque laudantium